The volatility earlier in the year, coupled with talk of trade wars (or real wars) might leave you fretting. If so, the “Sell In May” adage might have you thinking right now. Here we look at whether there is any basis for following the Sell in May process. The results are fascinating.
Every investor is seeking out the Holy Grail, that is an easily applied process which can generate consistently outstanding returns – we might define “outstanding” as performance at a decent margin better than the stock market index.
According to The Stock Market Almanac, Sell in May:
“is the strongest – and strangest – seasonality effect in the market.”
The full phrase runs something like this: sell in May and go away, buy again on St. Leger’s Day.
Our analysis simplifies these periods, adding some symmetry with a 6 month “Summer” period starting on 1st May and the 6 month “Winter” period beginning on 1st November. (Out of interest, using the numbers for 2nd October, St Leger Day, provides broadly similar results.)
Is there really any significant difference between the winter and summer returns?
We looked at the FTSE All Share going back to 1986 and found the following:
- Winter returns: 8.26% annualized return
- Summer returns: 0.87% annualized return
- Buy and Hold: 9.20%% annualized return
The difference between the Summer and Winter is extraordinary.
For example, if you only invested across the Summer in every year since 1986 you barely made any money at all!
But for those tempted to “Sell and Forget” every 1st May, and go on holiday for 6 months uninvested, the results were pretty good – but still not quite as good as “buy and hold” for the whole period.
So your approach might be dictated by how much you value peace of mind while on your summer hols!
But for most investors you should simply just buy an index tracker and follow the market, right? Not so fast…
Let’s not forget that the only reason why anyone explores the “Sell In May” idea is because they are seeking out that perfect investment process – consistent outperformance of the stock market.
Well if you are only going to buy an index tracker, and hold this in perpetuity, you have already given up seeking outstanding returns. But please don’t give up just yet – because the returns from one alternative process are staggeringly good.
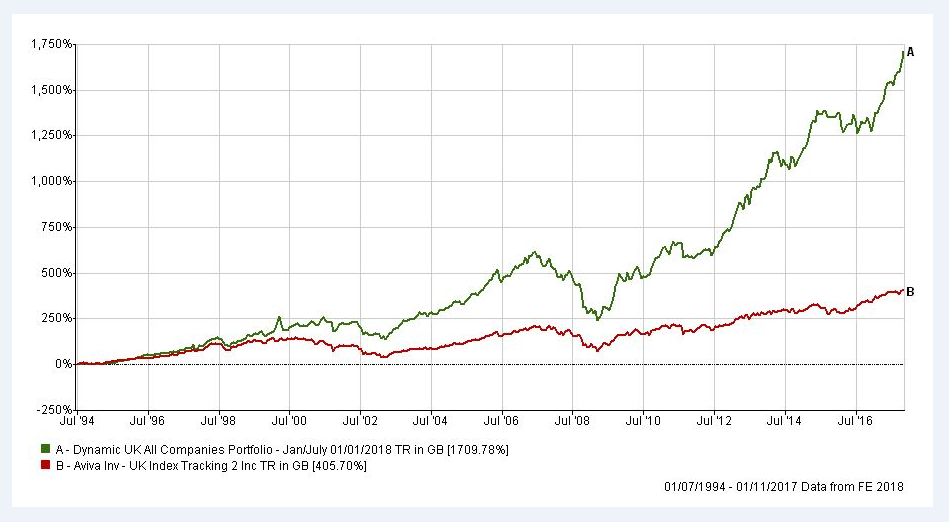
How difficult is it to buy the best three performing UK growth funds every 6 month? It isn’t difficult at all.
If you did that every year since 1994 (our stats only go back that far) you would have generated a return of 1709%, which is 1304% more (that is EXTRA growth) than buying and holding an index tracker over the same period (see chart 1 below)!
This is our
Dynamic UK Portfolio in action (more evidence
here, sector by sector).
Conclusion? The lazy “buy and hold” option has a very high cost.
ACTION FOR INVESTORS
- Sell in May? There are better options.
- Make sure you establish a process and apply it with discipline.
- Think your funds need some attention? Check your funds here
Chart 1: Dynamic UK Portfolio vs. Index Tracking Fund

(Image courtesy of The Barwick-in-Elmet Maypole Trust)