Source: Lightman Investment Management, 2024
- Value is performing better than is widely perceived, with broad outperformance across geographies and market caps.
- The performance is even stronger when adjusted for risk.
- US mega-cap growth is the major hold-out for growth outperformance in price terms. But strikingly US mega-cap growth is exhibiting high downside volatility, meaning that in risk-adjusted terms it is underperforming US large-cap value.
- Despite value’s long-term record, the pushback has always been about timing and the fear of being early. The work below suggests the turn for value is now well established and that its outperformance may be on track.
In this note we review the performance of low priced value equities compared to high priced growth equities across geographies and across the market cap spectrum.
We assess Europe, the US, the UK, Japan and Emerging Markets. For each, we look at small-cap, mid-cap and large-cap performance both in price terms and in risk-adjusted terms where we incorporate downside volatility and calculate the Sortino ratio.
We use two different measurement periods. The first is from November 2020 to date and the second shows the year to date performance.
The November 2020 start date is of course favourable for value. This date was chosen because it was a major turning point for value – one that has the potential to go down in stock market history. An entire book could be written on why value turned up then, but we could simplify the explanation to extreme undervaluation, extreme underweight positioning and the fundamentals changing.
We have used a lot of charts in this note and not much text, enabling the story to be told quickly. We look first at Europe and the US in the most detail, before a briefer review of the other markets.
Europe
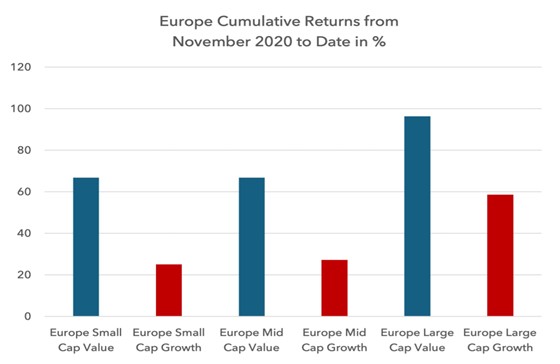
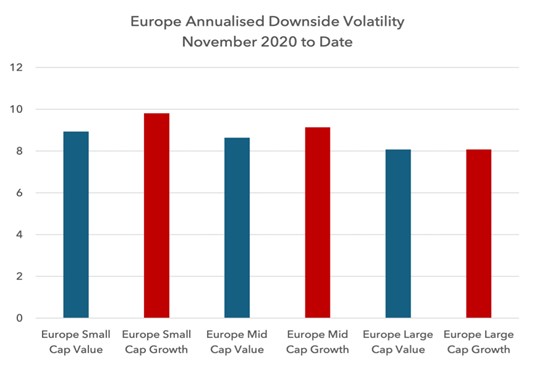
November 2020 to date
In Europe from November 2020 to the time of writing, value has outperformed growth across all market caps.
Value has exhibited equal or lower downside volatility to growth during this period, contributing to a superior Sortino ratio – or risk-adjusted return.
Year to Date
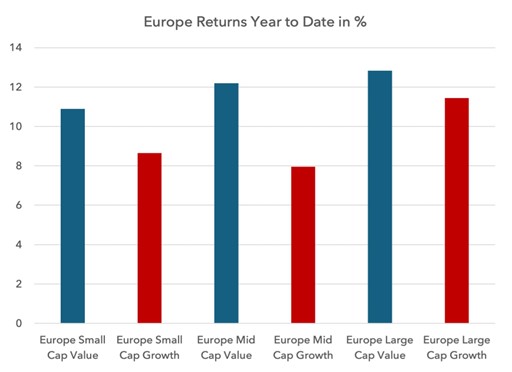
Performance
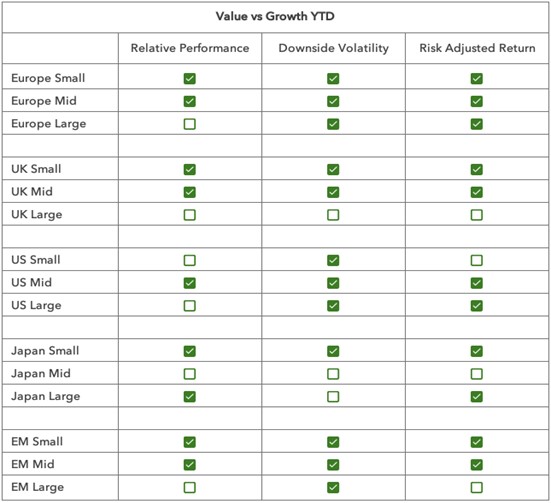
On a year to date basis, value has also outperformed in Europe, even in large caps.
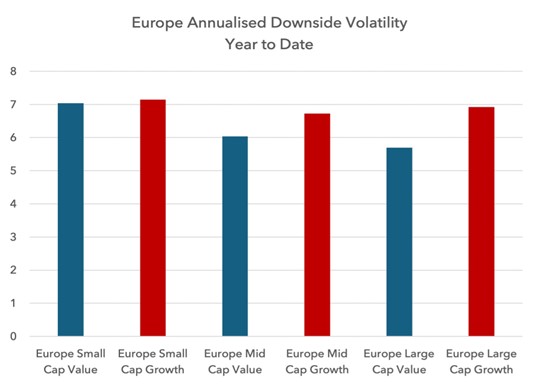
In recent months, European large-cap growth’s downside volatility has started to rise again compared to value, further weakening its risk-adjusted return profile.
US
November 2020 to date
In the US, investors may be surprised to see that small and mid-cap value has been outperforming since November 2020. Large-cap value has underperformed, but perhaps by less than some may have expected.
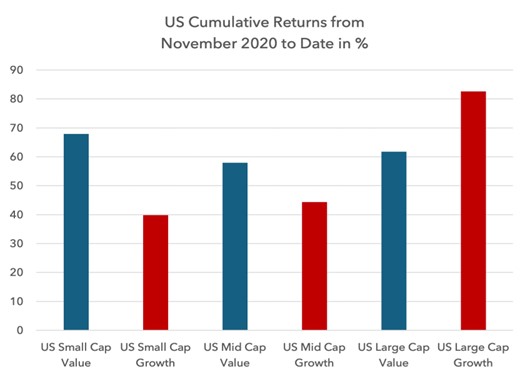
But the real surprise is in the downside volatility, which is far higher for US growth equities than US value equities in recent years.
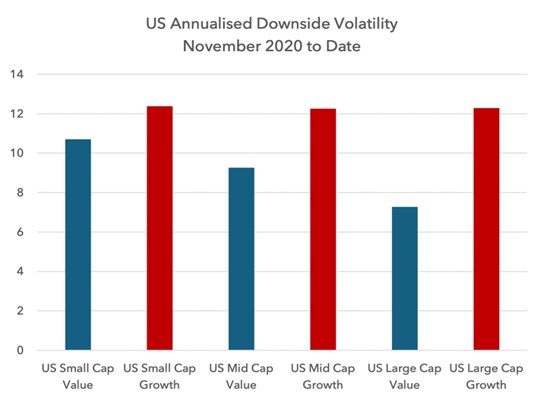
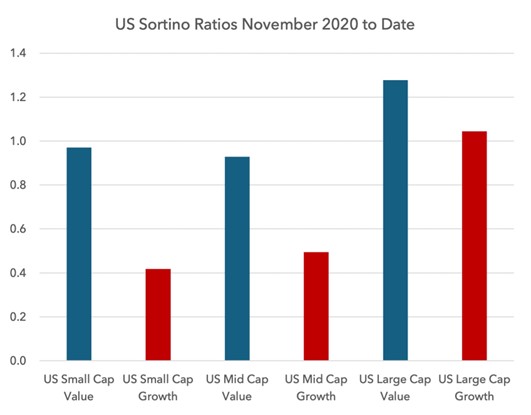
This has resulted in value posting a superior Sortino ratio even in large caps, from November 2020 to date.
Year to Date Performance
On a year to date basis in the US, growth has outperformed in small caps and large caps.
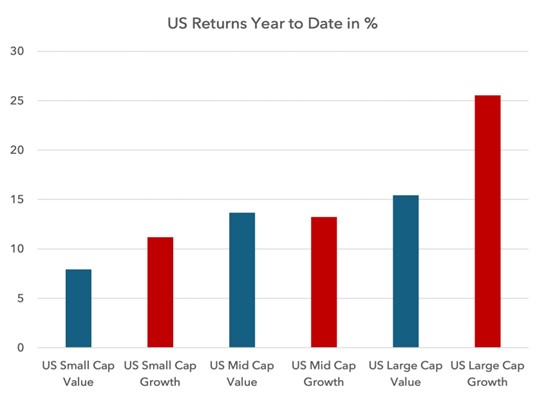
But once more, growth equities are seeing much higher downside volatility than value this year, especially in large caps. This is resulting in far superior risk-adjusted returns for US value over US growth in 2024.
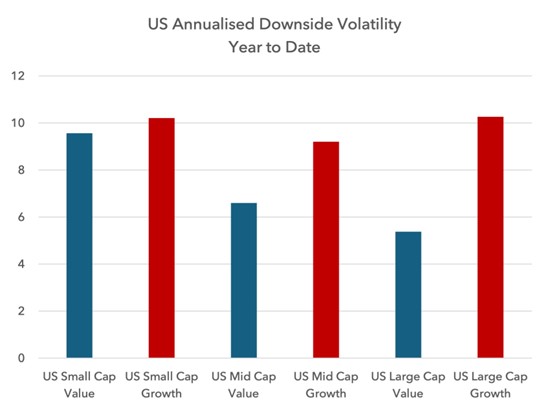
Downside volatility often rises before absolute price declines, and so this volatility from US growth equities is noteworthy. Whilst we cannot be sure that this relationship will hold in this circumstance, it is an important counterweight to the argument that US mega-cap growth stocks are a safe haven. The stock market’s behaviour under the surface is suggesting otherwise.
UK
In the UK, value has been dominant over growth since November 2020.
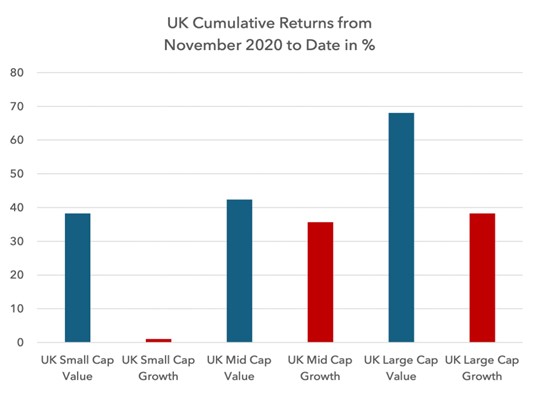
Year to date, large-cap value has underperformed by a small margin, whilst small and mid-cap value has outperformed.
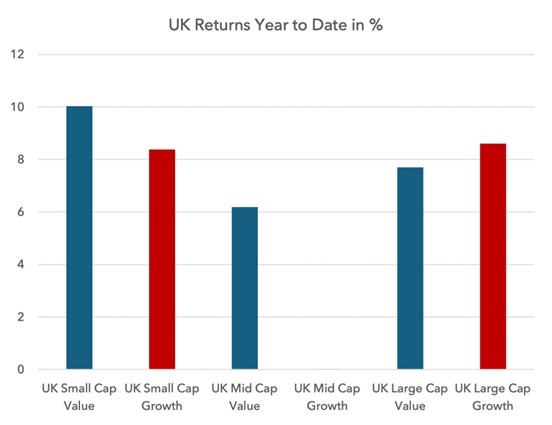
Downside volatility has not been very different between growth and value over both time periods, resulting in risk-adjusted returns that are relatively similar to the absolute returns.
Japan
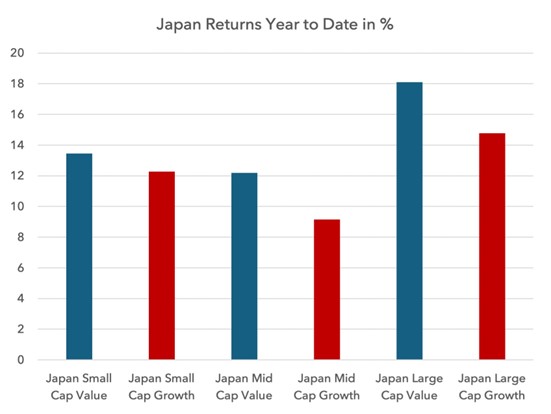
Like Europe and the UK, Japanese value has been dominant over growth since November 2020.
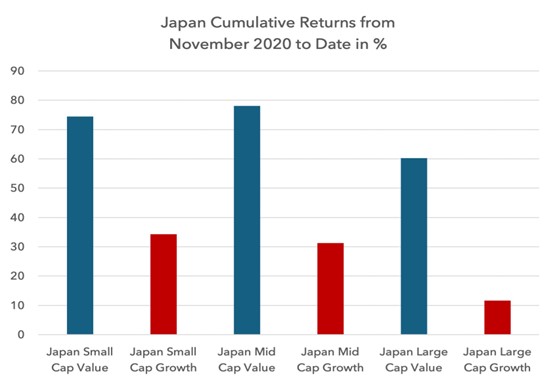
On a year to date basis, value has continued to dominate, with risk-adjusted returns better in small and large caps, but not in mid caps.
Emerging Markets
As in the UK, Europe and Japan, Emerging Market (“EM”) value has decisively outperformed growth since November 2020.
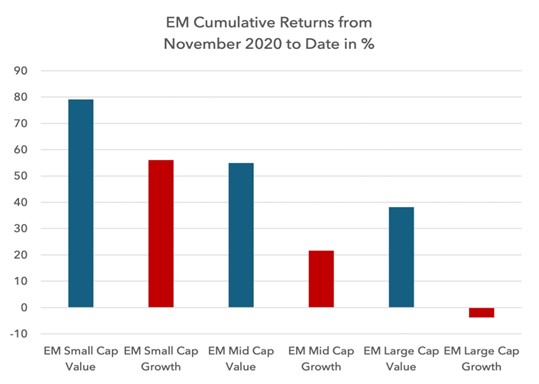
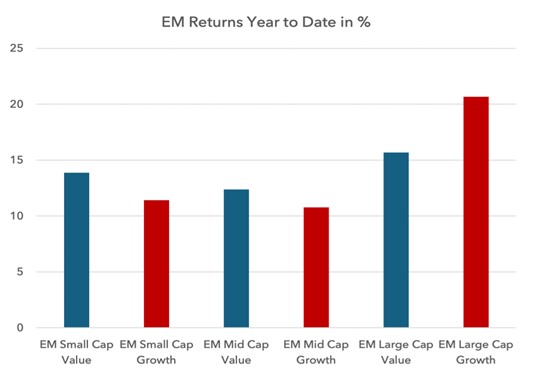
Year to date in Emerging Markets, small and mid-cap value have outperformed but not in large caps. As in the US, however, risk-adjusted returns for growth equities are weaker, driven by higher downside volatility.
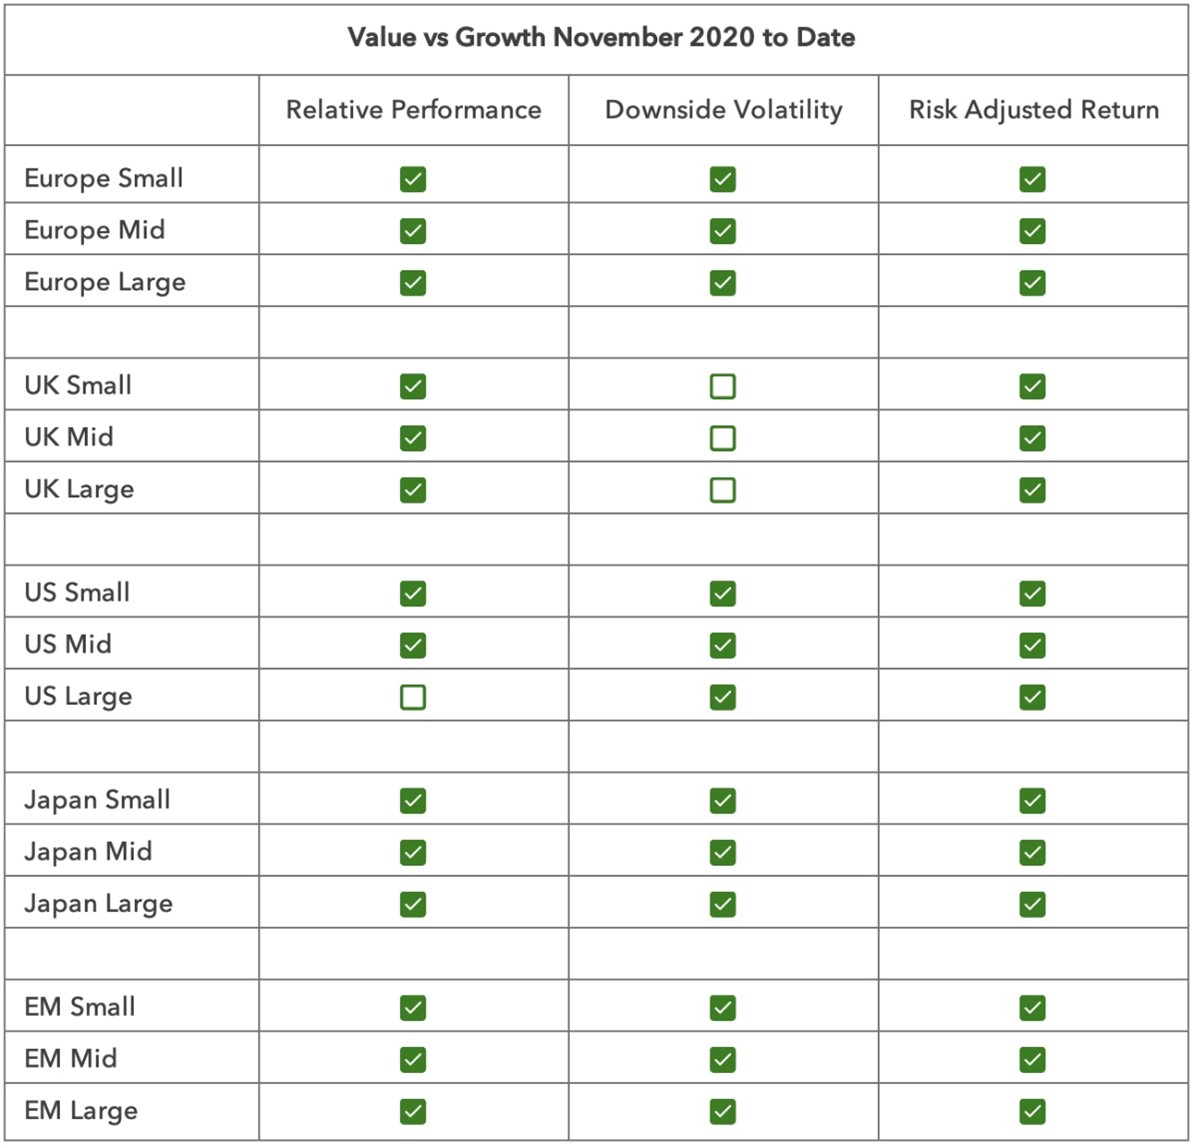
We summarise all the data in the following two tables.
A green tick means value is outperforming growth, either in price terms or with lower downside volatility or with a better Sortino ratio.
Whilst the logic for investor allocations towards value is sound, and the long-term track record solid, investors have been nervous about the timing. Value had a tough decade from 2010 to 2020, and this has cast a long shadow, resulting in heavy investor allocations to growth funds and light allocations to value.
The data above shows that value appears to have reasserted its dominance around the world. It is only really in US large caps that growth has decisively outperformed in price terms. But US large cap growth’s downside volatility is bad and showing signs of deteriorating further, making it inferior to value on a risk-adjusted basis.
The past century has taught us that our default expectation should be for value to outperform. For growth equity outperformance, we appear to need one or more of three elements in place. Ultra-low / negative interest rates, ultra-low / negative inflation and super-abundant liquidity. From 2010 to 2020 all three of these elements were in place, resulting in nirvana-like conditions for growth investors. But since late 2020 interest rates and inflation have moved to more normal levels. The liquidity backdrop has been volatile, tightening in late 2021 and 2022 before flooding back into the system in 2023. But this torrent (from the Reverse Repo Facility) started to run out in Q1 this year, and with it the last major support for expensive securities fell away.
We believe November 2020 marked a structural turning point for value. There is now nothing to wait for – no macro catalyst or flow-based signal is required. It appears simply that the typical behaviour of stock markets over the past century has returned.
Sources:
MSCI indices are used as proxies for the various market segments; Sortino ratios are calculated using annualised risk and return values; the 10 year treasury yield is used as the risk-free return. Other data taken from Bloomberg, Kenneth R French Data Library, Lightman Investment Management. All data to 30 September 2024.