In our monthly Dynamic Portfolio review we provide some background commentary and insights, as well as performance tables & graphs, risk tables, and where to go to find the new funds for each Dynamic Portfolio.
As ever, if you have any questions about the below research please do not hesitate to contact us.
The new funds for each Dynamic Portfolio will be listed below, or alternatively you can view the new funds on the designated Portfolio Library page.
Performance Graphs will be over their review period unless stated otherwise.
The Dynamic Portfolio’s below are sorted A-Z.
Commentary
There are 6 Dynamic Portfolios to update this month.
Over the past 6 months, the US and Japan emerged as the clear winners since January with the major indices up around 20%. Big tech and AI continued to dominate, while a weak yen and corporate reforms have been a tailwind in Japan, particularly for the big exporters.
Here are todays portfolios for update:
- Bonkers 3-Month Portfolio
- Bonkers 6-Month Portfolio
- Dynamic Asia (Including ITs) Porfolio
- Dynamic Cautious Portfolio
- Dynamic Commodities Portfolio
- Dynamic UK All Companies Portfolio
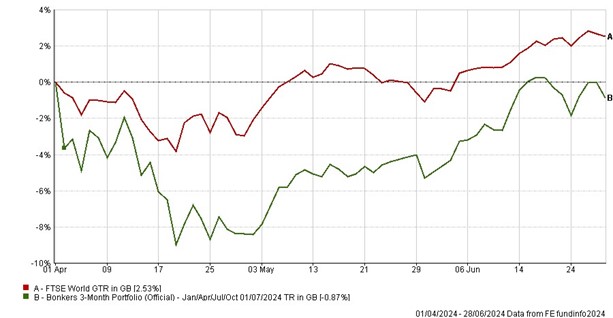
Starting with the Bonkers 3-Month Portfolio, it’s slightly down over the period at -0.87% versus up 2.53% for the FTSE World Index. Switching now from a US fund to an India fund after a fantastic month in June following the election.
The long-term figures for this Dynamic Portfolio are excellent, returning 4,935% versus 583% for the index. Nearly 8.5x that of the FTSE World.
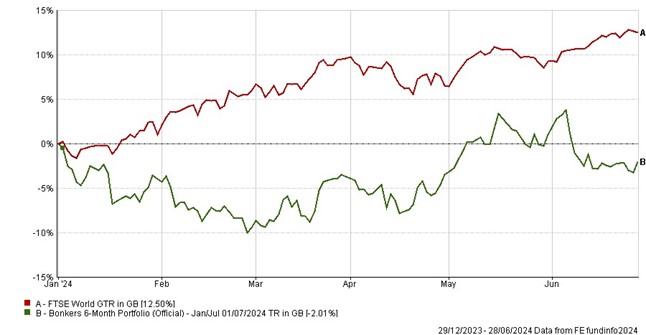
Bonkers 6-Month Portfolio has had a poor but not disastrous 6 months in European Property Equities, down 2.01%, but the Index is up 12.5%. The portfolio sticks with Fund Managers Janus Henderson for the next 6 months but over to US Tech as it continued to soar over the past 6 months.
Since inception, this Bonkers Portfolio is up 14,604% versus 1,248% for the FTSE World. Pretty extraordinary.
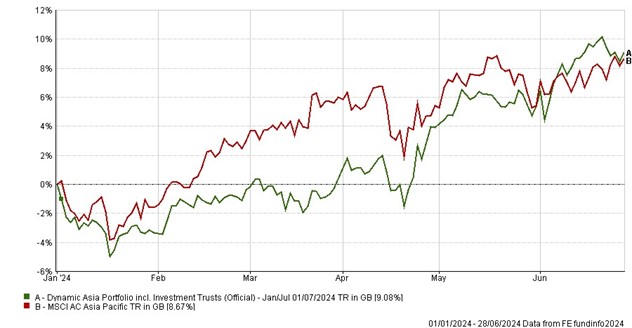
Moving to Asia with the Dynamic Asia including ITs Portfolio, it managed a slight gain on the Index as it is up 9.08% over the 6 months versus 8.67% for the MSCI Asia Pacific.
No surprise to see Asia up over the past 6 months as there’s been plenty of positives swirling, partly due to the widespread corporate governance reforms. As risks continue to grow in the West it’s hard to ignore this exciting area. The switch is out of smaller companies and into a more large-cap Growth style fund with Baillie Gifford Pacific.
This is one of our house favourite portfolios and the growth since inception is phenomenal, up 2,930% versus 206% for the index.
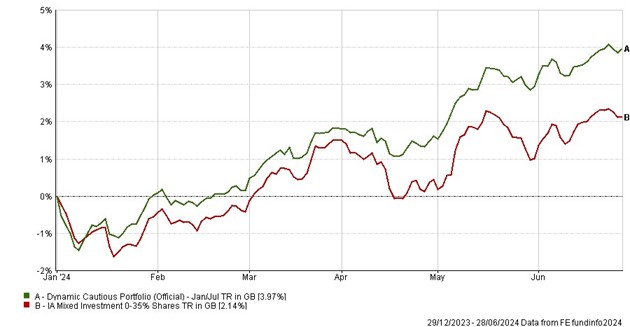
Dynamic Cautious is up 3.97% over the past 6 months compared to 2.14% for the index. However, we’ve been saying for a number of years for low-risk investors to take care when selecting funds in what is typically known as low-risk sectors. Whilst some of the yields in the corporate or property bond funds might be compelling, be wary of the exposure under the bonnet.
The two Man GLG funds remain for the next 6 months, and a notable addition is FF China High Yield. Long term performance of this portfolio is 1.7x better than the Index.
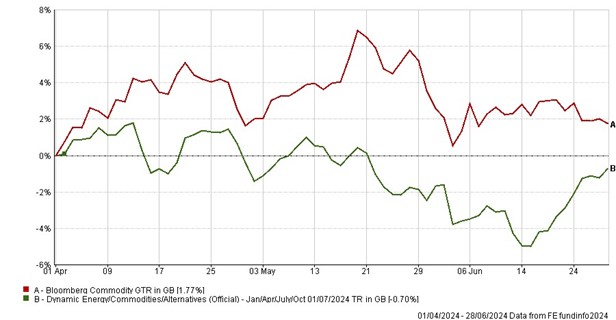
Commodities had a relatively flat month with Dynamic Commodities (a 3-month Portfolio) down slightly at -0.7% versus the Index up 1.77%.
Energy is out and gold is in with all 3 of the new fund selections for the next 3 months.
Since inception it’s up 22x the Index, even better than Bonkers!
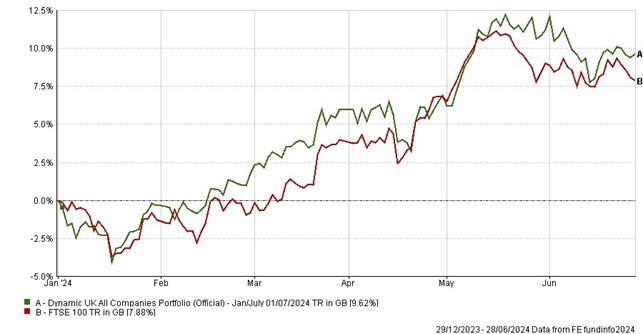
Finally turning to the UK, it's good to see continued strong performance with Dynamic UK All Companies up 9.62% versus the FTSE 100 up 7.88%. This Dynamic Portfolio is the basis of our original research from 1994 and is up 2,598% over the period versus the FTSE 100 up 712%.
Only one of the 3 funds remain for the next 6 months as JOHCM UK Growth and Artemis UK Select make it into the portfolio.
- Bonkers 3-Month Portfolio
-
3-Month Review
Bonkers 3-Month Portfolio: down 0.87%
FTSE World Index: up 2.53%
3-Month Performance Chart
Performance Table
|
Name
|
3m
|
6m
|
1yr
|
3yr
|
5yr
|
Since Inception
(Oct 99)
|
|
Bonkers 3-Month Portfolio
|
-0.87
|
-0.40
|
-11.14
|
-37.87
|
-11.76
|
4935.17
|
|
FTSE World Index
|
2.53
|
12.42
|
21.73
|
33.86
|
77.23
|
583.36
|
Risk Table
|
Name
|
Worst Month
|
5 Year Volatility *
|
5-Year Monthly VaR**
|
|
Bonkers 3-Month Portfolio
|
-25.97
|
25.19
|
-12.03
|
|
FTSE World Index
|
-12.52
|
13.18
|
-5.30
|
Review Table
- Bonkers 6-Month Portfolio – Jan-Jul
-
6-Month Performance
Bonkers 6-Months Portfolio: down 2.01%
FTSE World Index: up 12.50%
6-Month Performance Chart
Performance Table
|
Name
|
6m
|
1yr
|
3yr
|
5yr
|
Since Inception
(Jan 95)
|
|
Bonkers 6-Month Portfolio - Jan-Jul
|
-2.01
|
13.08
|
29.39
|
84.75
|
14604.41
|
|
FTSE World Index
|
12.50
|
21.73
|
33.86
|
77.23
|
1248.39
|
Risk
|
Name
|
Worst Month
|
5 Year Volatility *
|
5-Year Monthly VaR**
|
|
Bonkers 6-Month Portfolio - Jan-Jul
|
-29.20
|
25.41
|
-11.04
|
|
FTSE World Index
|
-16.00
|
13.18
|
-5.30
|
Review
- Dynamic Asia (including ITs)
-
6-Month Performance
Dynamic Asia (including ITs) Portfolio: up 9.08%
MSCI Asia Pacific Index: up 8.67%
6-Month Performance Chart
Performance Table
|
Name
|
6m
|
1yr
|
3yr
|
5yr
|
Since Inception
(Jan 00)
|
|
Dynamic Asia (including ITs)
|
9.08
|
10.22
|
17.90
|
146.20
|
2930.19
|
|
MSCI Asia Pacific Index
|
8.67
|
12.66
|
1.81
|
27.48
|
205.53
|
Risk
|
Name
|
Worst Month
|
5 Year Volatility *
|
5-Year Monthly VaR**
|
|
Dynamic Asia (including ITs)
|
-16.30
|
18.22
|
-7.45
|
|
MSCI Asia Pacific Index
|
-12.41
|
12.29
|
-6.98
|
Review
- Dynamic Cautious Portfolio
-
6-Month Performance
Dynamic Cautious Portfolio: up 3.97%
(UT) Mixed Investment 0-35% Shares Sector Average: up 2.14%
6-Month Performance Chart
Performance Table
|
Name
|
6m
|
1yr
|
3yr
|
5yr
|
Since Inception
(Jan 00)
|
|
Dynamic Cautious Portfolio
|
3.97
|
8.61
|
-11.80
|
-8.19
|
219.63
|
|
(UT) Mixed Investment 0-35% Shares Sector Average
|
2.14
|
7.60
|
-2.36
|
5.58
|
124.48
|
Risk
|
Name
|
Worst Month
|
5 Year Volatility *
|
5-Year Monthly VaR**
|
|
Dynamic Cautious Portfolio
|
-9.56
|
8.44
|
-3.53
|
|
(UT) Mixed Investment 0-35% Shares
Sector Average
|
-7.09
|
6.47
|
-1.77
|
Review
- Dynamic Commodities Portfolio
-
3-Month Performance
Dynamic Commodities Portfolio: down 0.70%
Bloomberg Commodities Index: up 1.77%
3-Month Performance Chart
Performance Table
|
Name
|
3m
|
6m
|
1yr
|
3yr
|
5yr
|
Since Inception
(Jan 09)
|
|
Dynamic Commodities Portfolio
|
-0.70
|
4.16
|
-3.56
|
19.77
|
114.47
|
343.60
|
|
Bloomberg Commodities Index
|
1.77
|
5.26
|
6.01
|
31.66
|
42.87
|
15.30
|
Risk
|
Name
|
Worst Month
|
5 Year Volatility *
|
5-Year Monthly VaR**
|
|
Dynamic Commodities Portfolio
|
-14.59
|
22.16
|
-8.22
|
|
Bloomberg Commodities Index
|
-10.88
|
14.56
|
-6.38
|
Review
- Dynamic UK All Companies Portfolio
-
6-Month Performance
Dynamic UK All Companies Portfolio: up 9.62%
FTSE 100 Index up 7.88%
6-Month Performance Chart
Performance Table
|
Name
|
6m
|
1yr
|
3yr
|
5yr
|
Since Inception
(Jul 94)
|
|
Dynamic UK All Companies Portfolio
|
9.62
|
18.47
|
22.79
|
42.61
|
2597.66
|
|
FTSE 100 Index
|
7.88
|
13.27
|
29.55
|
32.44
|
712.12
|
Risk
|
Name
|
Worst Month
|
5 Year Volatility *
|
5-Year Monthly VaR**
|
|
Dynamic UK All Companies Portfolio
|
-24.72
|
17.99
|
-5.77
|
|
FTSE 100 Index
|
-13.41
|
13.64
|
-6.13
|
Review
Performance data as of 30/06/2024
*A measure of the size and frequency of short-term changes in the value of an investment.
**Monthly Value at Risk (VaR). A VaR of 6% means that in 19 months out of 20 you should not, on average, expect a fall in the capital value of more than 6% in any one month. The VaR of a typical UK stock market fund is 6%, for reference.