As ever, if you have any questions about the below research please do not hesitate to contact us.
The new funds for each Dynamic Portfolio will be listed below, or alternatively you can view the new funds on the designated Portfolio Library page.
Performance Graphs will be over one-year period unless stated otherwise.
The Dynamic Portfolio’s below are sorted A-Z.
Commentary
Two Dynamic Portfolios are up for review this month and they are two favourites:
- Bonkers 6-month Portfolio
- Dynamic Asia & EM Portfolio
Bonkers 6-month Portfolio
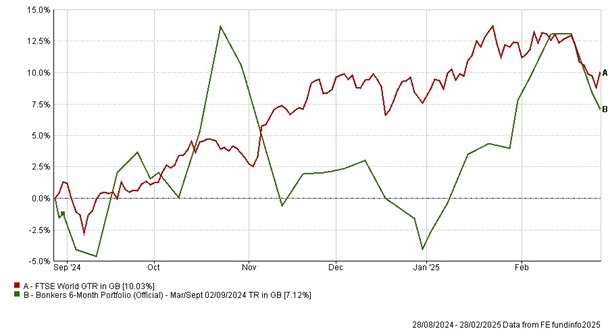
Starting with bonkers, it’s been a volatile 6 months for the gold miners fund. Remember, in simple terms, if the gold price moves 1%, we’d expect gold miners to move 2% or 3%, both on the way up and the way down. This fund was up over 12% early on, after giving it all back and then recovering to finish up over 7% for the period vs the FTSE World Index up 10%.
The long-term numbers of this Bonkers Portfolio are exceptional, up 20,654% since inception in 1995 vs the index 1,208%. That’s over 17x the index over the period.
The new fund for the next 6 months is in China following a strong 6 months as sentiment improves and investors start returning.
Dynamic Asia & EM Portfolio
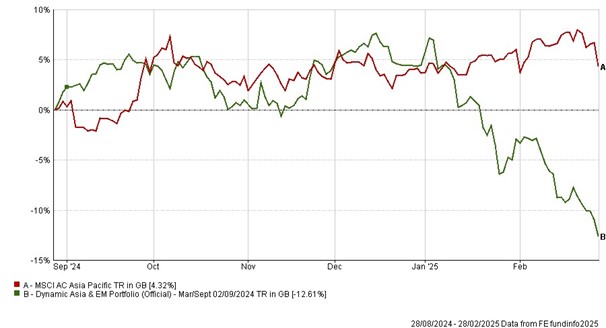
China may have had a strong 6 months, but it wasn’t enough to lift this portfolio as all three holdings were in India, which had a tough start to 2025 as one of the worst-performing markets. As a result, this Dynamic Portfolio dropped over 12% while the MSCI Asia Index was up over 4% (helped by China’s rally).
Despite the short term hit, the long term numbers remain impressive, up over 7,600% since inception vs 408% for the index. That’s nearly 19x the index.,
Unsurprisingly the next three funds going in are all China-focussed.
- Bonkers 6-Month Portfolio
-
6-Month Review
Bonkers 6-Month Portfolio: up 7.12%
FTSE World: up 10.03%
Review Period Performance Chart
Performance Table
|
Name
|
6m
|
1yr
|
3yr
|
5yr
|
Since Inception
(Sep 95)
|
|
Bonkers 6-Month Portfolio
|
7.12
|
5.08
|
54.95
|
177.83
|
20654.90
|
|
FTSE World
|
10.03
|
16.46
|
42.72
|
95.39
|
1208.33
|
Risk Table
|
Name
|
Worst Month
|
5 Year Volatility *
|
5-Year Monthly VaR**
|
|
Bonkers 6-Month Portfolio
|
-19.85
|
22.36
|
-12.25
|
|
FTSE World
|
-15.99
|
12.95
|
-5.04
|
Review Table
- Dynamic Asia & EM Portfolio
-
6-Month Performance
Dynamic Asia & EM Portfolio: down 12.61%
MSCI Asia Pacific: up 4.32%
Review Period Performance Chart
Performance Table
|
Name
|
6m
|
1yr
|
3yr
|
5yr
|
Since Inception
(Mar 99)
|
|
Dynamic Asia & EM Portfolio
|
-12.61
|
-5.27
|
30.46
|
105.41
|
7605.07
|
|
MSCI Asia Pacific
|
4.32
|
9.48
|
15.16
|
34.00
|
407.97
|
Risk
|
Name
|
Worst Month
|
5 Year Volatility *
|
5-Year Monthly VaR**
|
|
Dynamic Asia & EM Portfolio
|
-18.67
|
13.64
|
-5.56
|
|
MSCI Asia Pacific
|
-12.41
|
12.08
|
-7.19
|
Review
*A measure of the size and frequency of short term changes in the value of an investment.
**Monthly Value at Risk (VaR). A VaR of 6% means that in 19 months out of 20 you should not, on average, expect a fall in the capital value of more than 6% in any one month. The VaR of a typical UK stock market fund is 6%, for reference.
Performance data as of 28/02/2025