In our monthly Dynamic Portfolio review we provide some background commentary and insights, as well as performance tables & graphs, risk tables, and where to go to find the new funds for each Dynamic Portfolio.
As ever, if you have any questions about the below research please do not hesitate to contact us.
The new funds for each Dynamic Portfolio will be listed below, or alternatively you can view the new funds on the designated Portfolio Library page.
Performance Graphs will be over their review period unless stated otherwise.
The Dynamic Portfolio’s below are sorted A-Z.
Commentary
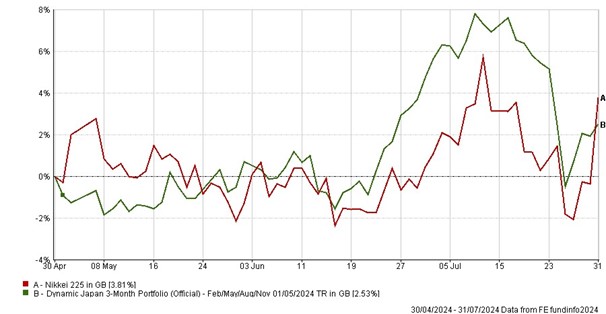
This month we have three Dynamic Portfolios up for review, starting with the Dynamic Japan 3-Month Portfolio, one of the few portfolios on a 3-month cycle.
Japan has had a volatile 3 months with the yen strengthening significantly recently, hurting the big exporters. Despite this, the Dynamic Portfolio managed a 2.53% gain, slightly behind the index which is up 3.81%.
Since inception, this portfolio is up over 5x the index.
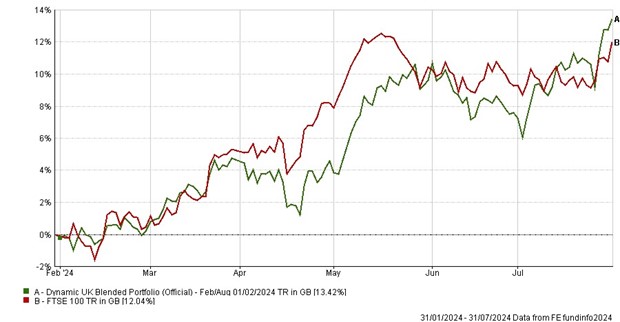
The next portfolio is Dynamic UK Blended which has had an excellent 6 months as the UK continues to shine, particularly in mid and small caps – a theme seen in other markets as well.
As a result the portfolio is up 13.42% in 6 months, a little more than the index which is up 12%.
The long-term numbers of this portfolio are also impressive as it has delivered over 1,000%, and 4.5x the return of the index since inception.
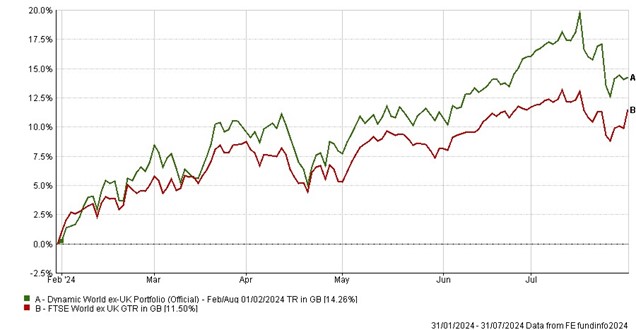
Lastly is the Dynamic World ex-UK Portfolio. Despite a few wobbles in big tech over in the US, this portfolio managed a gain of 14.26% over 6 months which beat the index, gaining 11.5%.
Though not one of our star performers, this portfolio is still up more than 2x the index since inception. The new funds for the next 6 months highlight the rotation to small caps performing well with 3 mid/smaller cap funds in Europe, the UK and the US.
- Dynamic Japan 3-Month Portfolio
-
3-Month Review
Dynamic Japan 3-Month Portfolio: up 2.53 %
Nikkei 225 Index: up 3.81 %
Review Period Performance Chart
Performance Table
|
Name
|
3m
|
6m
|
1yr
|
3yr
|
5yr
|
Since Inception
(Feb 00)
|
|
Dynamic Japan 3-Month Portfolio
|
2.53
|
15.54
|
12.95
|
4.60
|
52.42
|
418.62
|
|
Nikkei 225 Index
|
3.81
|
5.06
|
11.50
|
13.16
|
24.98
|
81.52
|
Risk Table
|
Name
|
Worst Month
|
5 Year Volatility *
|
5-Year Monthly VaR**
|
|
Dynamic Japan3-Month Portfolio
|
-17.55
|
17.21
|
-7.99
|
|
Nikkei 225 Index
|
-13.37
|
14.79
|
-7.96
|
Review Table
|
Old fund
|
New fund
|
|
Nomura Japan Strategic Value
|
JPM Japan
|
- Dynamic UK Blended Portfolio
-
6-Month Performance
Dynamic UK Blended Portfolio: up 13.42%
FTSE 100 Index: up 12.04%
Review Period Performance Chart
Performance Table
|
Name
|
6m
|
1yr
|
3yr
|
5yr
|
Since Inception
(Feb 00)
|
|
Dynamic UK Blended Portfolio
|
13.42
|
17.38
|
23.77
|
59.15
|
1007.27
|
|
FTSE 100 Index
|
12.04
|
12.99
|
33.40
|
32.82
|
220.52
|
Risk
|
Name
|
Worst Month
|
5 Year Volatility *
|
5-Year Monthly VaR**
|
|
Dynamic UK Blended Portfolio
|
-21.83
|
18.70
|
-5.17
|
|
FTSE 100 Index
|
-13.41
|
13.65
|
-5.81
|
Review
- Dynamic World ex-UK Portfolio
-
6-Month Performance
Dynamic World ex-UK Portfolio: up 14.26%
FTSE World ex-UK Index: up 11.50%
Review Period Performance Chart
Performance Table
|
Name
|
6m
|
1yr
|
3yr
|
5yr
|
Since Inception
(Feb 00)
|
|
Dynamic World ex-UK Portfolio
|
14.26
|
22.82
|
30.71
|
77.72
|
1105.72
|
|
FTSE World ex-UK Index
|
11.50
|
18.81
|
32.56
|
72.06
|
523.97
|
Risk
|
Name
|
Worst Month
|
5 Year Volatility *
|
5-Year Monthly VaR**
|
|
Dynamic World ex-UK Portfolio
|
-14.81
|
13.70
|
-5.66
|
|
FTSE World ex-UK Index
|
-12.60
|
13.21
|
-5.38
|
Review
Performance data as of 31/07/2024
*A measure of the size and frequency of short-term changes in the value of an investment.
**Monthly Value at Risk (VaR). A VaR of 6% means that in 19 months out of 20 you should not, on average, expect a fall in the capital value of more than 6% in any one month. The VaR of a typical UK stock market fund is 6%, for reference.