.png)
96% of investment funds are not good enough.
OK, you’ve already seen that stat this week, and you may think that is an attempt at a headline grab, but year after year this number is alarmingly high, and ultimately highlights the inefficiencies of the majority of the fund management industry.
We update this research every year because we believe you should invest into the best possible funds, and our Vintage Fund Ratings consider the longer-term consistency of a fund, as opposed to our Dynamic Fund Ratings which look at shorter-term momentum.
If you haven’t downloaded the Vintage Report yet, just head here to request your copy. The Report has all the meaty details I’m sure you’re keen to delve into, but below we will extract three of the more interesting elements of this year’s research, and highlight why (and perhaps why not) our Vintage funds are a brilliant indicator of outstanding funds.
Remember, to see which funds make up each of our Portfolio’s for each sector at the moment, use our “Best Funds By Sector Vintage Tool” on our website.
- Simply Put, Active Fund Managers Aren’t Good Enough
We, and many others, have been banging this drum for a while. To reiterate for those who are new to Vintage Ratings, to achieve a Vintage Rating, a fund must be in the top 40% of performers for at least 60% of the time. In plain English, be a bit better than average for just over half the time. Just 81 funds out of the 1871 funds analysed achieved this rating.
Perhaps more eye watering is the GBP value invested into Ugly funds, which this year totals £941bn…
For context, the value invested into Vintage funds is a measly £115bn.
- Mixed Sectors Continue To Dominate
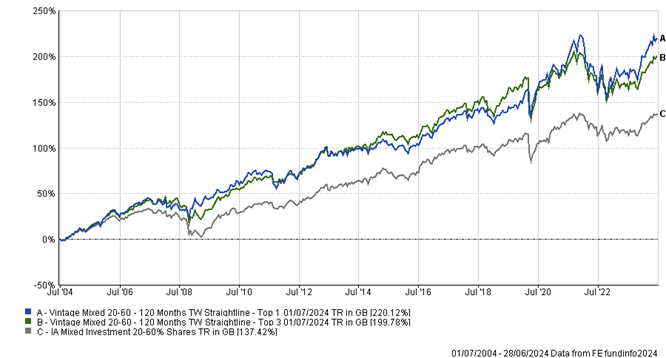
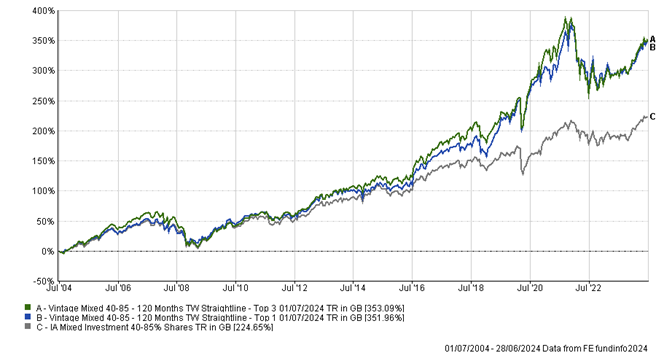
A standout every year, these sectors’ Vintage Portfolio’s consistently outperform their benchmarks. Especially in the Mixed 20-60% and 40-85% sectors, as shown below, the long-term performance is startling. It’s quite difficult to ascertain exactly why these sectors perform so consistently, especially given point 2 under “But Vintage Isn’t Perfect” below. *
Long Term Performance of The Vintage Mixed 20-60% Portfolio’s:

Long Term Performance of The Vintage Mixed 40-85% Portfolio’s:

*top 1 & top 3 are related to our Vintage Portfolio’s whereby every year we either pick the top rated Vintage fund or we pick the top 3. Either way, these fund(s) are held for 12 months until the next Vintage update, which usually falls in July.
3. Royal London Tops the Manager Charts, While Fidelity Is Pretty Ugly
Royal London boasts 10 Vintage funds for 2024, 4 more than Invesco who have 6 Vintage funds to their name. You can see Royal London’s Vintage fund list below, many of whom have retained their Vintage rating for multiple years now:
|
Royal London Corporate Bond
|
|
Royal London Global Bond Opportunities
|
|
Royal London Global Equity Income
|
|
Royal London Global Equity Select
|
|
Royal London Sterling Credit
|
|
Royal London Sterling Extra Yield Bond
|
|
Royal London Sustainable Diversified Trust
|
|
Royal London Sustainable Managed Growth Trust
|
|
Royal London Sustainable World Trust
|
|
Royal London UK Dividend Growth
|
On the flip side, Fidelity runs the highest number of Ugly rated funds (those with a Vintage score of less than 40%), with 41 funds holding this most unsavoury title.
But Vintage Isn’t Perfect
Like every “experiment” Vintage does have its weaknesses, and we’re open enough to admit these. For those of you who are clients of Dennehy Wealth and who are invested into our Model Portfolio’s, you’ll notice that right now Vintage doesn’t have an overweight in many of our Portfolio’s, and although this can change as time and markets develop, the main reasons for this are:
- Vintage can be slow to represent market pivots.
Take the swing from many sectors moving to more Value styles since 2020, our annual research may take several years of updated ratings to highlight these swings. Though the gradual decline in Vintage ratings for many historical “growth” funds (such as several Baillie Gifford funds) since 2020 does indicate the trend does get picked up in small doses.
- There’s no obvious pattern to indicate which asset classes work best with our Vintage ratings.
Take the 4 UK corporate bond sectors that we analyse within our Vintage research, there is no obvious pattern as to why certain sub sectors of this asset class work with Vintage, in terms of both risk and return, as you can see below. On the flip side, we know that with our shorter-term Dynamic Ratings it doesn’t work across almost all bond sectors (UK & Overseas), so we focus our research efforts onto various equity markets on the Dynamic side of things.
Sterling Strategic Bonds: Vintage works consistently. Top 1 best. Top 3 second. Stop losses would help.
Sterling Corporate Bonds: Vintage does not work. Sector average outperforms both Top 1 & Top 3 portfolios.
Sterling HY: Both outperform. Top 3 best. Top 1 close behind. Generally, not a big difference between all three.
**Targeted Absolute Return: Vintage works for top 1, top 3 consistently underperforms sector average. Both Vintage Portfolios are far more volatile than the sector average.
**For the Targeted Absolute Return sector, we only have research from 2015.
- Changes to the sectors can distort ratings
We’ve seen tweaks to many Investment Association (IA) sectors in recent years, whether to the Global Bonds sector, Specialist, or most recently the combination of IA Japan & IA Japanese Smaller Companies sectors. These changes to sectors can most certainly distort a funds vintage rating.
For example, if a fund was a member of the Specialist sector, therefore being compared to say 50 other funds within that sector for our Vintage research, and then was moved into the IA Technology sector and now is only being compared to 8 other funds, even if the performance of said fund was consistent before & after this move, it’s Vintage rating could quickly be distorted given it’s peer group has suddenly changed from one year to the next.
On the contrary, our Dynamic Ratings will pick up these changes very quickly, simply due to their higher frequency review periods.
Overall, our Vintage Ratings help to identify funds who, over a wide range of market cycles and macro events, can consistently outperform their peer group. But also, and perhaps more importantly, it identifies just how inefficient much of our industry is at managing your money. We also know for reasons mentioned above that Vintage ratings may not be your sole reason to buy or sell a fund, but we hope it aids you in making informed investment decisions nonetheless.