In our monthly Dynamic Portfolio review we provide some background commentary and insights, as well as performance tables & graphs, risk tables, and where to go to find the new funds for each Dynamic Portfolio.
As ever, if you have any questions about the below research please do not hesitate to contact us.
The new funds for each Dynamic Portfolio will be listed below, or alternatively you can view the new funds on the designated Portfolio Library page.
Performance Graphs will be over their review period unless stated otherwise.
The Dynamic Portfolio’s below are sorted A-Z.
Commentary
This month we have two Dynamic Portfolios up for review, Bonkers 6-Months and Dynamic Asia & EM Portfolio.
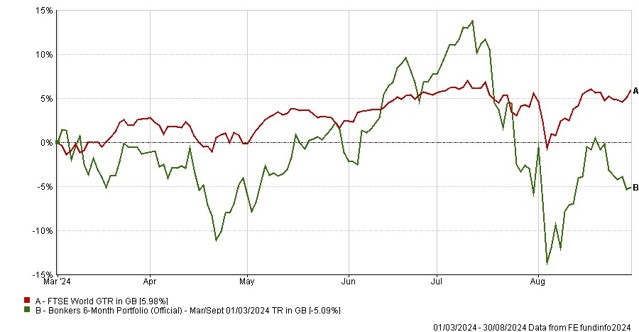
Bonkers had a tricky 6 months in Liontrust Global Technology, down 5% for the period. No surprise given market skepticism creeping in around the practical applications of AI and the fact the Liontrust fund has 15% in Nvidia and TSMC.
But the long-term performance of this Bonkers portfolio is staggering, up over 19,000% since September 1995 which is more than 17x the World index.
Looking ahead, a Gold fund will take over for the next six months..
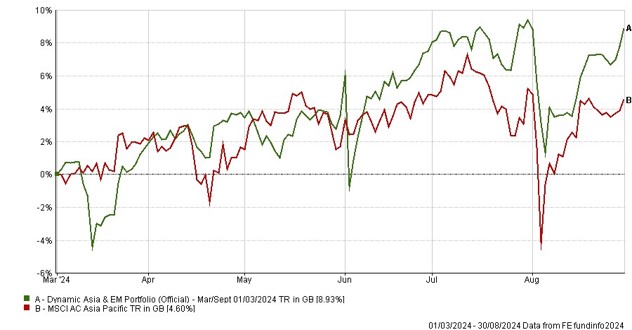
It’s been a stronger period for Dynamic Asia & EM, up nearly 9% vs the index up 4.6%. This has largely been driven by the two India funds and the next period sees all three spots taken by India.
Like Bonkers, the long-term performance of this portfolio is exceptional, returning over 7,500% since inception which is over 19x the index.
- Bonkers 6-Month Portfolio – Mar/Sept
-
6-Month Review
Bonkers 6-Month Portfolio: down 5.09%
FTSE World Index: up 5.98%
Review Period Performance Chart
Performance Table
|
Name
|
6m
|
1yr
|
3yr
|
5yr
|
Since Inception
(Sep 95)
|
|
Bonkers 6-Month Portfolio
|
-5.09
|
16.38
|
14.13
|
130.33
|
19031.92
|
|
FTSE World Index
|
5.98
|
20.51
|
28.52
|
73.61
|
1104.63
|
Risk Table
|
Name
|
Worst Month
|
5 Year Volatility *
|
5-Year Monthly VaR**
|
|
Bonkers 6-Month Portfolio
|
-19.85
|
22.13
|
-11.99
|
|
FTSE World Index
|
-15.99
|
13.04
|
-5.13
|
Review Table
- Dynamic Asia & EM Portfolio
-
6-Month Review
Dynamic Asia & EM Portfolio: up 8.93%
MSCI AC Asia Pacific Index: up 4.60%
Review Period Performance Chart
Performance Table
|
Name
|
6m
|
1yr
|
3yr
|
5yr
|
Since Inception
(Mar 99)
|
|
Dynamic Asia & EM Portfolio
|
8.93
|
37.14
|
37.77
|
94.51
|
7551.93
|
|
MSCI AC Asia Pacific Index
|
4.60
|
14.12
|
5.37
|
26.66
|
391.08
|
Risk
|
Name
|
Worst Month
|
5 Year Volatility *
|
5-Year Monthly VaR**
|
|
Dynamic Asia & EM Portfolio
|
-18.67
|
14.44
|
-6.04
|
|
MSCI AC Asia Pacific Index
|
-12.41
|
12.16
|
-6.98
|
Review
Performance data as of 30/08/2024
*A measure of the size and frequency of short-term changes in the value of an investment.
**Monthly Value at Risk (VaR). A VaR of 6% means that in 19 months out of 20 you should not, on average, expect a fall in the capital value of more than 6% in any one month. The VaR of a typical UK stock market fund is 6%, for reference.