In our monthly Dynamic Portfolio review we provide some background commentary and insights, as well as performance tables & graphs, risk tables, and where to go to find the new funds for each Dynamic Portfolio.
As ever, if you have any questions about the below research please do not hesitate to contact us.
The new funds for each Dynamic Portfolio will be listed below, or alternatively you can view the new funds on the designated Portfolio Library page.
Performance Graphs will be over their review period unless stated otherwise.
The Dynamic Portfolio’s below are sorted A-Z.
Commentary
The first review of the year is here, and there’s a lot to unpack across our Dynamic Portfolios. Over the past six months, the US maintained its dominance, but the spotlight shifted from big tech to smaller companies leading the charge. China started to recover as government stimulus kicked in, and Global Emerging Market bonds rebounded strongly after a tough few years.
Here are today’s portfolios for update:
- Bonkers 3-Month Portfolio
- Bonkers 6-Month Portfolio
- Dynamic Asia (Including ITs) Portfolio
- Dynamic Cautious Portfolio
- Dynamic Commodities Portfolio
- Dynamic UK All Companies Portfolio
Bonkers 3-Month Portfolio
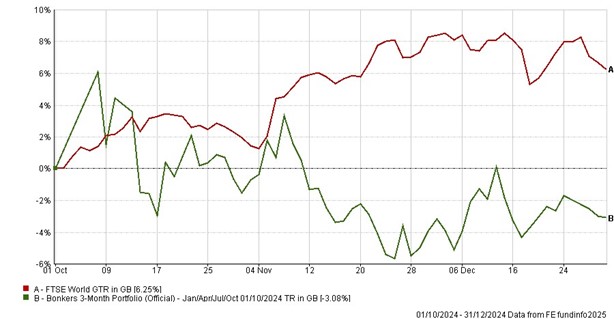
This portfolio lived up to its unpredictable nature over the period, falling 3.08% while the FTSE World was up an impressive 6.25%. Volatility in China, still dealing with economic challenges and high expectations for more government stimulus weighed on performance.
However, this portfolio’s long-term performance remains extraordinary with a 4,696% gain since inception in 1999, which is 7.5x the FTSE World’s 629%.
Looking ahead, China is swapped for a US Growth fund for the next 3 months.
Bonkers 6-Month Portfolio
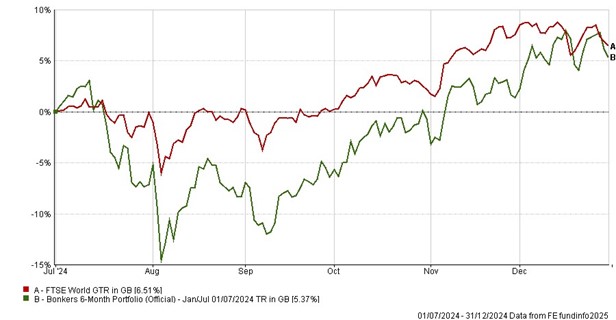
The Bonkers 6-Month Portfolio delivered a solid 5.37%, just behind the FTSE World’s 6.51%. A tech-heavy US focus paid off, though the gap reflects some strong performance elsewhere across the globe.
Its long-term performance is even more impressive than Bonkers 3-month, returning 15,512% since inception in 1995, or approximately 11.6x the FTSE World.
For the next six months, it stays aligned with the Bonkers 3-Month Portfolio, switching into the same US Growth fund to capture any ongoing opportunities in the states.
Dynamic Asia (Including ITs) Portfolio
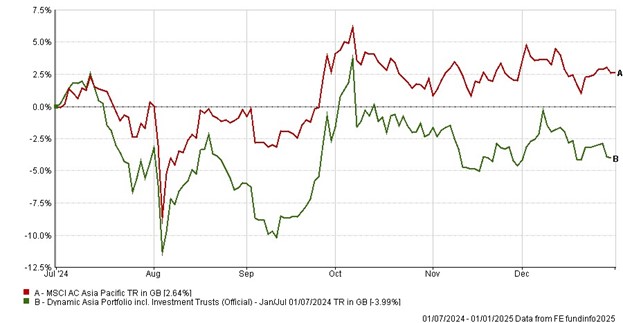
This portfolio struggled over the past six months, dropping 3.99%, while the MSCI Asia Pacific Index gained 2.64%, dragged down by some weak stock selection in China and India which make up half of the Baillie Gifford Pacific fund.
Maybe the switch into the new Barings fund which invests at least 70% of assets into ASEAN countries will provide some stronger momentum.
Over the long-term again, the portfolio has delivered returns far in excess of the benchmark, with 2,812% return vs the MSCI Asia Pacific Index return of 213% over the same time period.
Dynamic Cautious Portfolio
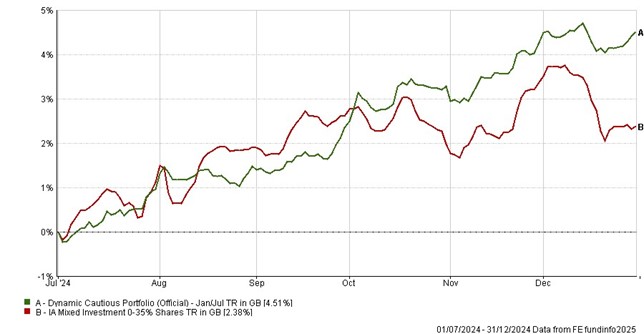
Designed for more stability, the Dynamic Cautious Portfolio gained an impressive 4.51% over six months, comfortably outpacing the Mixed 0-35% sectors 2.38%.
Invested in 5 funds for more diversification, the previous period saw the portfolio invested in the likes of property, China and UK corporate bonds. Over the long-term, it has returned nearly 2x the sector average’s 129%, certainly noteworthy for a Cautious Portfolio.
Dynamic Commodities Portfolio
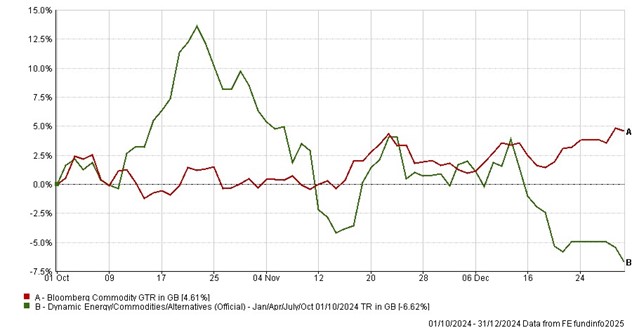
This portfolio is on a 3-month review cycle and faced a tough quarter, down 6.62% versus the Bloomberg Commodities Index’s 4.61% gain. Gold took a breather from record breaking highs and with all 3 funds in volatile gold miners, it impacted on performance.
However, this is still one of our best performing Dynamic Portfolios vs the index, delivering 364.47% since January 2009, a remarkable 22x the Bloomberg Commodities Index’s 16.61% over the same period.
The portfolio moves out of gold with new positions in funds focused on both clean and traditional energy sources.
Dynamic UK All Companies Portfolio
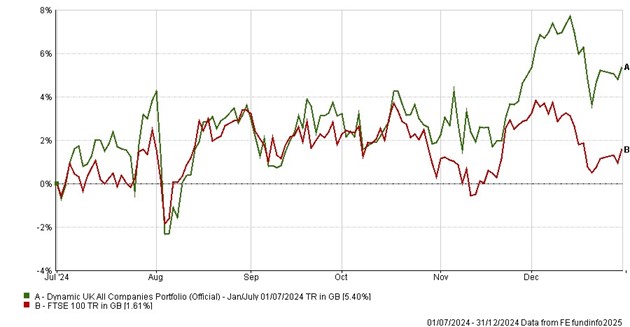
Last but not least, this portfolio gained 5.4% over six months compared to the FTSE 100’s 1.61%, 3.4x the index over just 6 months and highlighting the strength that momentum can offer for selecting funds in the UK over just buying the index.
Its long-term performance further reinforces its success. Since July 1994, it has returned 2,731.84%, which is nearly 4x the FTSE 100’s 725.47% over the same period.
- Bonkers 3- Month Portfolio
-
3-Month Review
Bonkers 3-Month Porfolio: down 3.08%
FTSE World: up 6.25%
Performance Chart
Performance Table
|
Name
|
3m
|
6m
|
1yr
|
3yr
|
5yr
|
Since Inception
(Oct 99)
|
|
Bonkers 3-Month Portfolio
|
-3.08
|
-4.58
|
-4.45
|
-29.30
|
-25.66
|
4696.86
|
|
FTSE World
|
6.25
|
6.51
|
20.07
|
30.63
|
79.77
|
629.35
|
Risk Table
|
Name
|
Worst Month
|
5 Year Volatility *
|
5-Year Monthly VaR**
|
|
Bonkers 3-Month Portfolio
|
-25.97
|
23.18
|
-12.07
|
|
FTSE World
|
-12.52
|
13.14
|
-5.06
|
Review Table
- Bonkers 6-Month Portfolio
-
6-Month Review
Bonkers 6-Month Portfolio: up 5.37%
FTSE World: up 6.51%
Performance Chart
Performance Table
|
Name
|
6m
|
1yr
|
3yr
|
5yr
|
Since Inception
(Jan 95)
|
|
Bonkers 6-Month Portfolio
|
5.37
|
4.04
|
25.37
|
80.09
|
15512.41
|
|
FTSE World
|
6.51
|
20.07
|
30.63
|
79.77
|
1339.13
|
Risk Table
|
Name
|
Worst Month
|
5 Year Volatility *
|
5-Year Monthly VaR**
|
|
Bonkers 6-Month Portfolio
|
-29.20
|
25.44
|
-11.23
|
|
FTSE World
|
-15.99
|
13.14
|
-5.06
|
Review Table
- Dynamic Asia (Including ITs) Portfolio
-
6-Month Review
Dynamic Asia (Inc.ITs) Portfolio: down 3.99%
MSCI Asia Pacific Index: up 2.64%
Performance Chart
Performance Table
|
Name
|
6m
|
1yr
|
3yr
|
5yr
|
Since Inception
(Jan 00)
|
|
Dynamic Asia (Inc.ITs) Portfolio
|
-3.99
|
4.85
|
7.38
|
128.43
|
2812.71
|
|
MSCI Asia Pacific Index
|
2.64
|
11.57
|
9.37
|
26.16
|
213.67
|
Risk Table
|
Name
|
Worst Month
|
5 Year Volatility *
|
5-Year Monthly VaR**
|
|
Dynamic Asia (Inc. ITs) Portfolio
|
-16.30
|
18.43
|
-7.62
|
|
MSCI Asia Pacific Index
|
-12.41
|
12.19
|
-7.29
|
Review Table
- Dynamic Cautious Portfolio
-
6-Month Review
Dynamic Cautious Portfolio: up 4.51%
UT Mixed Investment 0-35% Share Sector Average: up 2.38%
Performance Chart
Performance Table
|
Name
|
6m
|
1yr
|
3yr
|
5yr
|
Since Inception
(Jan 00)
|
|
Dynamic Cautious Portfolio
|
4.51
|
8.71
|
-9.82
|
-3.75
|
234.66
|
|
Mixed Investment 0-35%
Share Sector Average
|
2.38
|
4.42
|
-1.37
|
5.38
|
129.46
|
Risk Table
|
Name
|
Worst Month
|
5 Year Volatility *
|
5-Year Monthly VaR**
|
|
Dynamic Cautious Portfolio
|
-9.56
|
8.19
|
-3.35
|
|
Mixed Investment 0-35%
Share Sector Average
|
-7.09
|
6.49
|
-1.80
|
Review Table
- Dynamic Commodities Portfolio
-
3-Month Review
Dynamic Commodities Portfolio: down 6.62%
Bloomberg Commodity: up 4.61%
Performance Chart
Performance Table
|
Name
|
3m
|
6m
|
1yr
|
3yr
|
5yr
|
Since Inception
(Jan 09)
|
|
Dynamic Commodities Portfolio
|
-6.62
|
4.27
|
9.45
|
12.60
|
94.22
|
364.47
|
|
Bloomberg Commodities
|
4.61
|
0.81
|
7.22
|
21.85
|
46.69
|
16.61
|
Risk Table
|
Name
|
Worst Month
|
5 Year Volatility *
|
5-Year Monthly VaR**
|
|
Dynamic Commodities Portfolio
|
-14.59
|
21.26
|
-8.41
|
|
Bloomberg Commodities
|
-10.88
|
14.69
|
-6.54
|
Review Table
- Dynamic UK All Companies Portfolio
-
6-Month Review
Dynamic UK All Companies: up 5.40%
FTSE 100: up 1.61%
Performance Chart
Performance Table
|
Name
|
6m
|
1yr
|
3yr
|
5yr
|
Since Inception
(Jul 94)
|
|
Dynamic UK All Companies Portfolio
|
5.40
|
15.33
|
23.50
|
35.52
|
2731.84
|
|
FTSE 100
|
1.61
|
9.66
|
23.92
|
29.83
|
725.47
|
Risk Table
|
Name
|
Worst Month
|
5 Year Volatility *
|
5-Year Monthly VaR**
|
|
Dynamic UK All Companies Portfolio
|
-24.72
|
17.74
|
-5.59
|
|
FTSE 100
|
-13.41
|
13.47
|
-5.41
|
Review Table
*A measure of the size and frequency of short-term changes in the value of an investment.
**Monthly Value at Risk (VaR). A VaR of 6% means that in 19 months out of 20 you should not, on average, expect a fall in the capital value of more than 6% in any one month. The VaR of a typical UK stock market fund is 6%, for reference.
Performance data as of 31/12/2024