In our monthly Dynamic Portfolio review we provide some background commentary and insights, as well as performance tables & graphs, risk tables, and where to go to find the new funds for each Dynamic Portfolio.
As ever, if you have any questions about the below research please do not hesitate to contact us.
The new funds for each Dynamic Portfolio will be listed below, or alternatively you can view the new funds on the designated Portfolio Library page.
Performance Graphs will be over their review period unless stated otherwise.
The Dynamic Portfolio’s below are sorted A-Z.
Commentary
Four portfolios are up for review this month:
- Bonkers 3-Month
- Dynamic Commodities Portfolio
- Dynamic Global Portfolio
- Dynamic UK Smaller
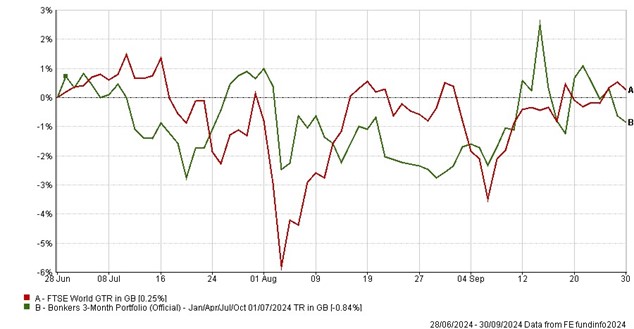
Bonkers 3-Month Portfolio
It was a very quiet three months for Bonkers, down 0.8%, versus up 0.25% for the World Index.
Despite the small dip, the long-term numbers for this portfolio are still Bonkers, up over 4,800% versus the index up around 585% since October 1999. That’s more than 8x the index.
Looking ahead, the next three months sees the portfolio shift to China, which has been on a stellar run since government introduced stimulus measures at the end of September.
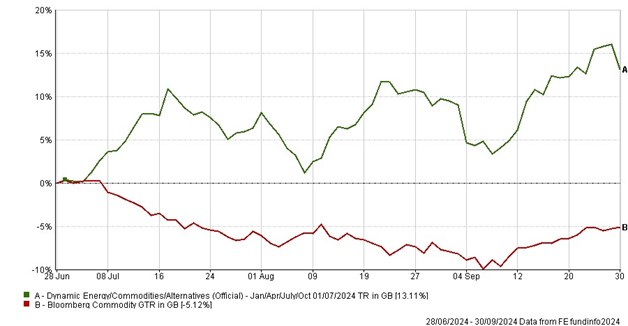
Dynamic Commodities Portfolio
Dynamic Commodities had an excellent three months fueled by gold’s strong run to new all-time highs. The portfolio ended the period up over 13% versus the Commodity Index which fell 5.1%.
Long-term, the portfolio’s performance is remarkable, returning 44x the index since its inception in January 2009.
Given gold’s recent performance, the portfolio sticks with precious metals and gold miners for the next three months. This portfolio tends to bring up some weird and wonderful funds, so it could be an option for those with a higher risk appetite.
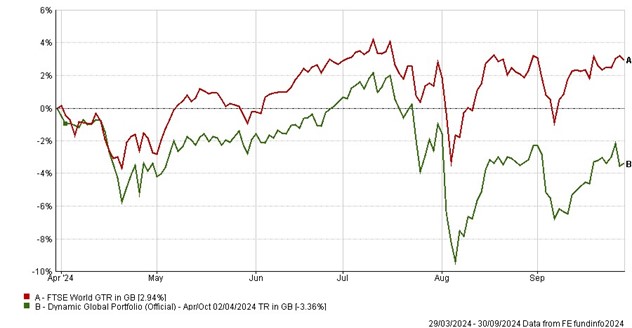
Dynamic Global Portfolio
On a 6-month cycle, Dynamic Global had a challenging period due to the three funds being in the US and Japan. The flash crash in Japan at the start of August hurt the portfolio and it’s been relatively sluggish since then. However, it’s still delivered 1,727% since October 1999, nearly 3x the index.
The upcoming six months will see a shift to one Asia fund and two UK funds which will be interesting given the UK Budget announcement later this month.
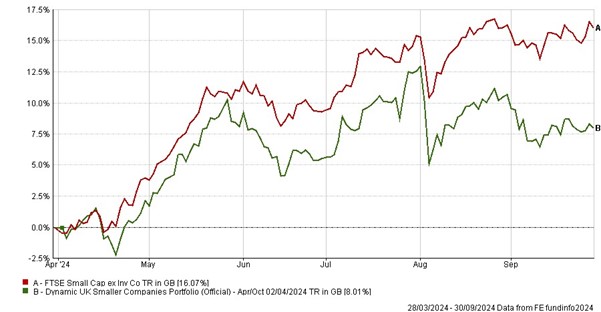
Dynamic UK Smaller Companies
Sticking with the UK, the Dynamic UK Smallers portfolio was up 8% over the period but lagged the index which is up over 16% over the period.
UK smaller companies remain attractively cheap and the long term numbers for this portfolio are impressive, up 2,271% since inception in October 1999 versus the index which is up 360%.
- Bonkers 3-Month Portfolio
-
3-Month Review
Bonkers 3-Month Portfolio: down 0.84%
FTSE World Index: up 0.25%
Review Period Performance Chart
Performance Table
|
Name
|
3m
|
6m
|
1yr
|
3yr
|
5yr
|
Since Inception
(Oct 99)
|
|
Bonkers 3-Month Portfolio
|
-0.84
|
-1.70
|
-11.63
|
-27.94
|
-24.86
|
4849.16
|
|
FTSE World Index
|
0.25
|
3.23
|
20.90
|
31.55
|
71.68
|
585.10
|
Risk Table
|
Name
|
Worst Month
|
5 Year Volatility *
|
5-Year Monthly VaR**
|
|
Bonkers 3-Month Portfolio
|
-25.97
|
23.83
|
-12.32
|
|
FTSE World Index
|
-12.52
|
13.06
|
-5.30
|
Review Table
|
Old fund
|
New fund
|
|
Stewart Investors Indian
Subcontinent Sustainability
|
FSSA All China
|
- Dynamic Commodities Portfolio
-
3-Month Performance
Dynamic Commodities Portfolio: up 13.11%
Bloomberg Commodity Index: down 5.12%
Review Period Performance Chart
Performance Table
|
Name
|
3m
|
6m
|
1yr
|
3yr
|
5yr
|
Since Inception
(Jan 09)
|
|
Dynamic Commodities Portfolio
|
13.11
|
12.32
|
10.26
|
25.47
|
114.92
|
401.76
|
|
Bloomberg Commodity Index
|
-5.12
|
-2.42
|
-8.13
|
11.99
|
33.74
|
9.40
|
Risk
|
Name
|
Worst Month
|
5 Year Volatility *
|
5-Year Monthly VaR**
|
|
Dynamic Commodities Portfolio
|
-14.59
|
21.08
|
-7.78
|
|
Bloomberg Commodity Index
|
-10.88
|
14.82
|
-6.58
|
Review
- Dynamic Global Portfolio – Apr/Oct
-
6-Month Performance
Dynamic Global Portfolio: down 3.36%
FTSE World Index: up 3.23%
Review Period Performance Chart
Performance Table
|
Name
|
6m
|
1yr
|
3yr
|
5yr
|
Since Inception
(Oct 99)
|
|
Dynamic Global Portfolio – Apr/Oct
|
-3.36
|
16.12
|
0.55
|
79.69
|
1727.30
|
|
FTSE World Index
|
3.23
|
20.90
|
31.55
|
71.68
|
585.10
|
Risk
|
Name
|
Worst Month
|
5 Year Volatility *
|
5-Year Monthly VaR**
|
|
Dynamic Global Portfolio – Apr/Oct
|
-14.62
|
14.61
|
-6.45
|
|
FTSE World Index
|
-12.52
|
13.06
|
-5.30
|
Review
- Dynamic UK Smaller Companies Portfolio
-
6-Month Performance
Dynamic UK Smaller Companies Portfolio: up 8.01%
FTSE Small Cap (ex IT): up 16.07%
Review Period Performance Chart
Performance Table
|
Name
|
6m
|
1yr
|
3yr
|
5yr
|
Since Inception
(Oct 99)
|
|
Dynamic UK Smaller Companies Portfolio
|
8.01
|
20.20
|
-10.35
|
49.18
|
2271.80
|
|
FTSE Smallcap (ex IT)
|
16.07
|
22.38
|
4.33
|
57.02
|
360.18
|
Risk
|
Name
|
Worst Month
|
5 Year Volatility *
|
5-Year Monthly VaR**
|
|
Dynamic UK Smaller Companies Portfolio
|
-22.39
|
20.14
|
-5.17
|
|
FTSE Smallcap (ex IT)
|
-25.79
|
21.16
|
-5.17
|
Review
Performance data as of 30/09/2024
*A measure of the size and frequency of short term changes in the value of an investment.
**Monthly Value at Risk (VaR). A VaR of 6% means that in 19 months out of 20 you should not, on average, expect a fall in the capital value of more than 6% in any one month. The VaR of a typical UK stock market fund is 6%, for reference.