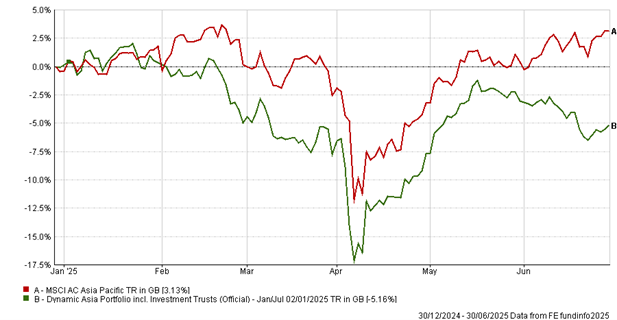
Below you will find an overview of how we built the portfolio and then the performance details for each individual portfolio including a performance chart, table and details of the most recent review.
Remember that the reviews we track here are carried out at set points during the year. If you wish to create this portfolio on a different cycle then you can do that using the tools on the site.
Portfolio Overview
With this portfolio we have tweaked the process slightly from our normal approach. Here we are selecting from a universe of funds that not only includes Unit Trusts, but also Investment Trusts.
Why? Our research on the main Asia sector has shown that combining Investment Trusts and Unit Trusts increases the likelihood of significant outperformance.
Sectors: (UT) Asia Pacific Excluding Japan, (IT) Asia Pacific
Fund selection: Best single fund from these sectors
Review period: 6-monthly
Our review cycle: January/July
To re-create this portfolio on a different review cycle simply go to Best Funds by Sector > Combined universe and select (UT&IT) Asia Pacific. You can then sort the results by 6-month performance and select the best performing fund from this combined sector.
Performance Chart (Last 6 Months)

Performance Table
| Name |
6m (%) |
1yr (%) |
3yr (%) |
5yr (%) |
| Dynamic Asia Portfolio (including ITs) - Jan/Jul |
-5.16 |
-1.14 |
15.42 |
103.08 |
| MSCI Asia Pacific Index |
3.13 |
6.28 |
22.50 |
30.19 |
| Data as of: 01/07/2025 |
|
|
|
|
Latest Review
The latest fund from Jul 2025 is: