Below you will find an overview of how we built the portfolio and then the performance details for each individual portfolio including a performance chart, table and details of the most recent review.
Portfolio Overview
With this portfolio we have tweaked the process slightly from our normal approach. Here we are looking at performance over the last 3 months to select the best three funds from our universe of funds. Though the obviously high-risk nature of this approach will not suit many, there are key lessons from this regardless.
The benefit of the momentum approach with this portfolio is that when one market or focussed sub-sector dominates performance for a period you should quickly benefit from that trend, and when that trend weakens you should move to the new leaders.
This approach is based off our original research, which you can see here.
Sectors: The FundExpert Commodities Universe (UT's only)
Fund selection: Best three funds from our Commodities Universe
Review period: 3-monthly
Our review cycles: January/April/July/October
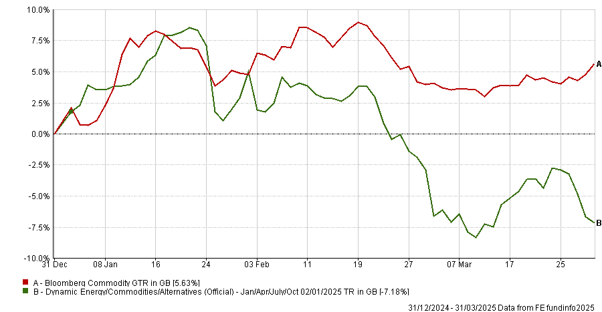
Performance Chart (Last 3 Months)

Performance Table
|
Name
|
3m (%)
|
6m (%)
|
1yr (%)
|
3yr (%)
|
5yr (%)
|
| Dynamic Commodities Portfolio |
-7.18 |
-14.08 |
-3.49 |
1.98 |
119.19 |
| Bloomberg Commodity Index |
5.63 |
11.67 |
8.97 |
-1.20 |
87.65 |
| Data as of: 01/04/2025 |
|
|
|
|
|
Latest Review
The latest funds from Apr 2025 are: